Original research
Six in ten of Britain's smallest businesses had no website, and nobody official has checked since 2019
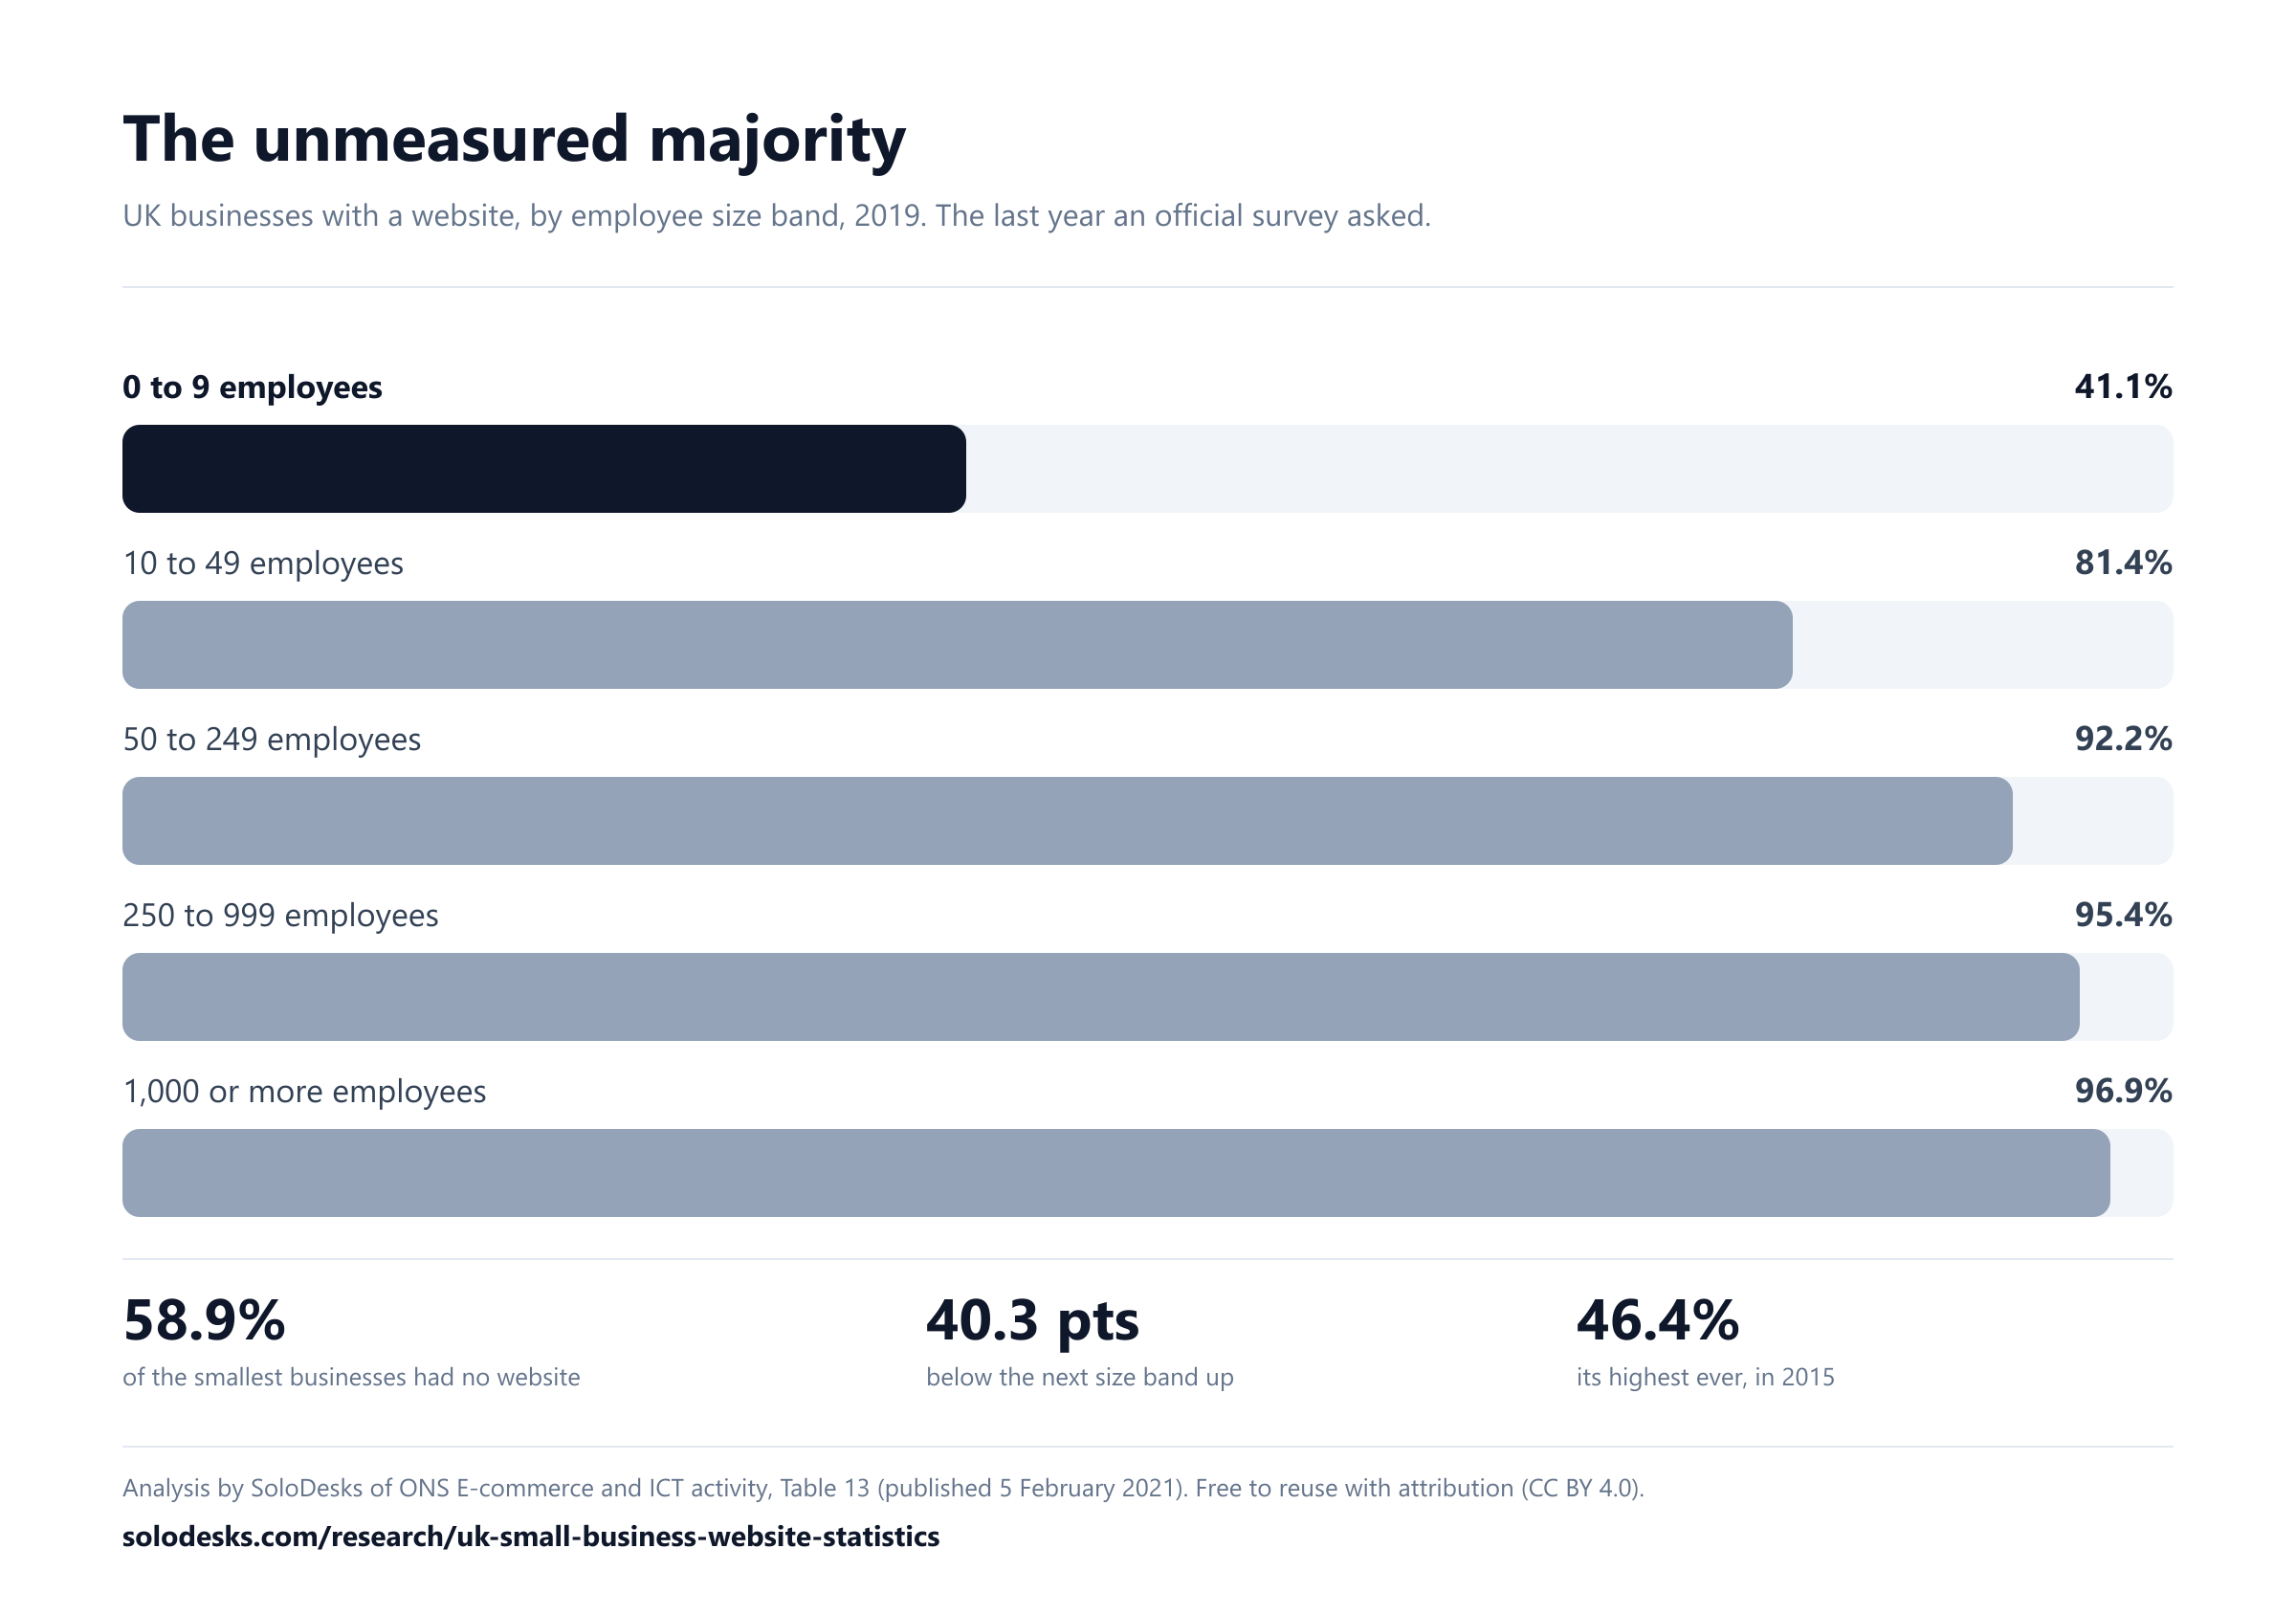
In 2019, 41.1% of UK businesses with fewer than ten employees had a website. That leaves 58.9% without one, and it is the most recent answer that exists. The survey that asked the question published its last edition in February 2021, the survey that replaced it stopped asking, and that replacement is now paused. We call this the unmeasured majority.
This page carries no trade-specific figure, on purpose. The ONS table behind it is broken down by size of business and by nothing else, so it cannot say what share of plumbers, or of construction, or of any single trade has a website. Anyone quoting one from this release is quoting something that is not in it. Measuring that directly is the second half of this study, and the method is set out at the bottom of this page before the numbers exist, rather than after.
By Sage Vinson. Published 2 September 2026. Every figure read out of the ONS spreadsheet cell on the same day.
The cliff at ten employees
Website ownership does not taper off as businesses get smaller. It holds up almost perfectly until the smallest band and then falls off the end. In 2019 every size band above nine employees sat between 81.4% and 96.9%. The band below it sat at 41.1%.
The last year the question was asked. Source: ONS, E-commerce and ICT activity, 2019 edition, Table 13.
Every band above nine employees sits between 81% and 97%. The smallest businesses sit 40.3percentage points below the next band up. That is not a slope, it is a cliff, and the whole of the UK’s solo self-employment lives at the bottom of it.
40.3 percentage points separate a business with nine employees from one with ten. Nothing about the work changes at that line. What changes is whether there is anybody whose job is to build the thing.
It never reached half, in any year it was asked
ONS did not survey businesses with fewer than ten employees between 2005 and 2013. Coverage restarted with the 2014 survey, which gives six years of readings before the series ends. The highest of them is 46.4%, in 2015.
| Year | 0 to 9 employees | 10 to 49 employees |
|---|---|---|
| 2014 | 43.5% | 77.7% |
| 2015 | 46.4% | 80.6% |
| 2016 | 40.4% | 81.5% |
| 2017 | 42.1% | 79.3% |
| 2018 | 44.6% | 81.9% |
| 2019 | 41.1% | 81.4% |
Read the level, not the direction. ONS records a break in this series at 2018, when the questionnaire moved from paper to an electronic form, and says the change affected the smallest band specifically. So the movement between any two of these years cannot be treated as growth or decline. What the six readings support is narrower and harder to argue with: across every year the question was put to them, fewer than half of the country’s smallest businesses had a website.
The number was published, and then went unread
This is not a leaked figure or a hard-won derivation. It has been downloadable from the ONS website since 5 February 2021. The reason it is not in circulation is that the bulletin attached to it steered readers away: its analysis, it says, focuses on businesses with 10 or more employees because results for those are considered more robust, and results for smaller businesses are available in the dataset but should be used with caution.
That is a reasonable statistical caution and it had a predictable effect. Coverage of the release followed the bulletin, quoted the figures for businesses with ten or more employees, and left the larger population unmentioned. The caution is worth repeating, and it is in the limitations below. It is not a reason to leave the only measurement anybody has taken sitting unquoted for five years.
Then the question stopped being asked
The reason 2019 is the most recent answer is not that the figure stopped mattering. It is a sequence of three separate decisions, each defensible on its own, which together removed the measurement.
1. The survey published its last edition
E-commerce and ICT activity, covering the 2019 calendar year, was published on 5 February 2021. It is the final edition of that survey.
2. Its replacement measured something else
The Digital Economy Survey, whose 2021 results were published in April 2023, reports whether businesses make sales through a website. That is a different question. A one-person trade business does not sell through a website, it gets phoned. Under the new measure it looks the same as a business with no web presence at all.
3. The replacement was paused
The ONS survey information page states that the Digital Economy Survey is being paused and will not collect data in respect of 2023. The page was last updated 19 March 2024. No date has been published for its return.
None of that is a scandal. Statistical agencies retire surveys and rebuild them all the time, and a paused survey is not an abolished one. But the practical position is that if you want to know whether the smallest businesses in Britain are findable online today, there is no official source that can tell you, and there has not been one for years.
It is not that they did not need one
The obvious objection to the headline is that a business with no website may simply have decided it does not need a website. The same ONS release makes that harder to sustain. Table 21 asked the same businesses how they send invoices.
How businesses with 0 to 9 employees sent invoices, 2019
- Sent e-invoices in a format suitable for automated processing
- 16.9%
- Sent invoices electronically, but not in an automated format
- 50.9%
- Issued or sent paper invoices
- 38%
Businesses could report more than one method, so these do not sum to 100%. Source: ONS, E-commerce and ICT activity, 2019 edition, Table 21.
More than a third were still putting paper invoices in the post, and fewer than one in five sent anything a computer could read without a human retyping it. A missing website in that company is not a considered decision about channel strategy. It sits alongside every other system that never got built, for the same reason: there is one person, and they were on a job.
What we are doing about the gap, stated before we do it
The limitation that matters most here is that this dataset has no industry split, so it says nothing about the trades specifically. That number does not exist anywhere we can find. So rather than infer it, we are going to measure it, and the method is written down here first so it cannot be adjusted afterwards to suit the result.
Pre-registered method
- A fixed list of UK towns and cities chosen for spread across nations, regions and settlement size, written down before any data is collected.
- A fixed list of trades, taken from the trades this site already covers, so the sample cannot be tuned to the answer.
- For each town and trade pair, the businesses returned by a public maps search, with the presence or absence of a website field recorded for each.
- Every business counted once. Deduplication by place identifier, not by name, because the same business can be listed under several names.
- The full counts published, including the ones that undermine the headline, along with the towns, the trades and the date of collection.
What that method can and cannot show, said now rather than later: it measures businesses that appear on a maps service, which is itself a form of online presence, so it will systematically miss the least findable businesses and will therefore understate the share with no web presence at all. It is a floor, not an estimate of the true figure.
Limitations
Every reason to treat the figure above carefully, including the ones that weaken it.
There is a break in the series at 2018, and ONS says so
For the 2018 survey the questionnaire moved from paper to an electronic form. ONS records that the change affected results for the 0 to 9 employee band specifically, creating a discontinuity in that band and in the all-business estimates. So the year-to-year movements in the smallest band cannot be read as a trend, and nothing on this page reads them as one. What survives the break is the level: in every year the band was surveyed, from 2014 to 2019, fewer than half of the smallest businesses had a website.
Nought to nine employees is not the same as one person
The band puts the sole trader and the nine-person firm in one number. Everywhere else in the same table, website ownership rises with headcount, so the figure for one-person businesses on their own is very likely below 41.1%. How far below is not published and is not derivable from this source, so it is not estimated here.
This number has no industry split
Table 13 breaks website ownership down by size of business and by nothing else. The survey does cover construction, but the website series is not published by sector, so nothing here can be said about tradespeople specifically. That gap is the reason for the second half of this study, which goes and measures trade businesses directly rather than inferring them from a national figure.
ONS asked readers to treat the small-business figures with caution
The bulletin states that results for businesses with fewer than 10 employees should be used with caution, because response rates in that group are lower. That caution is why the figure is quoted here as the last official measurement rather than as a precise present-day count, and it is another reason a direct measurement is worth taking.
The absence is a pause, not an abolition
The Digital Economy Survey is described by ONS as paused, not cancelled. If it returns and carries the website question with it, this page will be updated to say so. As things stand there is no announced date for either.
Sources
- E-commerce and ICT activity, 2019 edition (dataset), Table 13. Office for National Statistics. 5 February 2021. Covers the proportion of UK businesses with a website, by employment size band, 2007 to 2019.
- E-commerce and ICT activity, UK: 2019. Office for National Statistics. 5 February 2021. Covers the statistical bulletin, whose analysis is restricted to businesses with 10 or more employees.
- E-commerce and ICT activity QMI. Office for National Statistics. quality and methodology information, undated on page. Covers survey population, size bands, industry coverage and sample size.
- Digital Economy Survey, UK: 2021. Office for National Statistics. 20 April 2023. Covers the successor survey, which reports website sales rather than website ownership.
- E-commerce Survey (survey information page). Office for National Statistics. page last updated 19 March 2024. Covers whether the survey is currently collecting data.
The ONS releases are published under the Open Government Licence v3.0. Every percentage on this page was read from the published spreadsheet on 2 September 2026, from the cell itself, not from the bulletin’s prose and not from a summary of it.
Take these figures
The full series, every year and every size band, as a CSV. The chart as a PNG or an SVG. No form, no email address, and no permission needed beyond the link below.
In a sentence
For a caption or a line of body copy.
Analysis by SoloDesks of ONS E-commerce and ICT activity, 2019 edition, Tables 13 and 21. https://solodesks.com/research/uk-small-business-website-statistics
As HTML
Paste straight into a post. Includes the link the licence asks for.
<p>Source: <a href="https://solodesks.com/research/uk-small-business-website-statistics">Analysis by SoloDesks of ONS E-commerce and ICT activity, 2019 edition, Tables 13 and 21.</a></p>
As an embedded chart
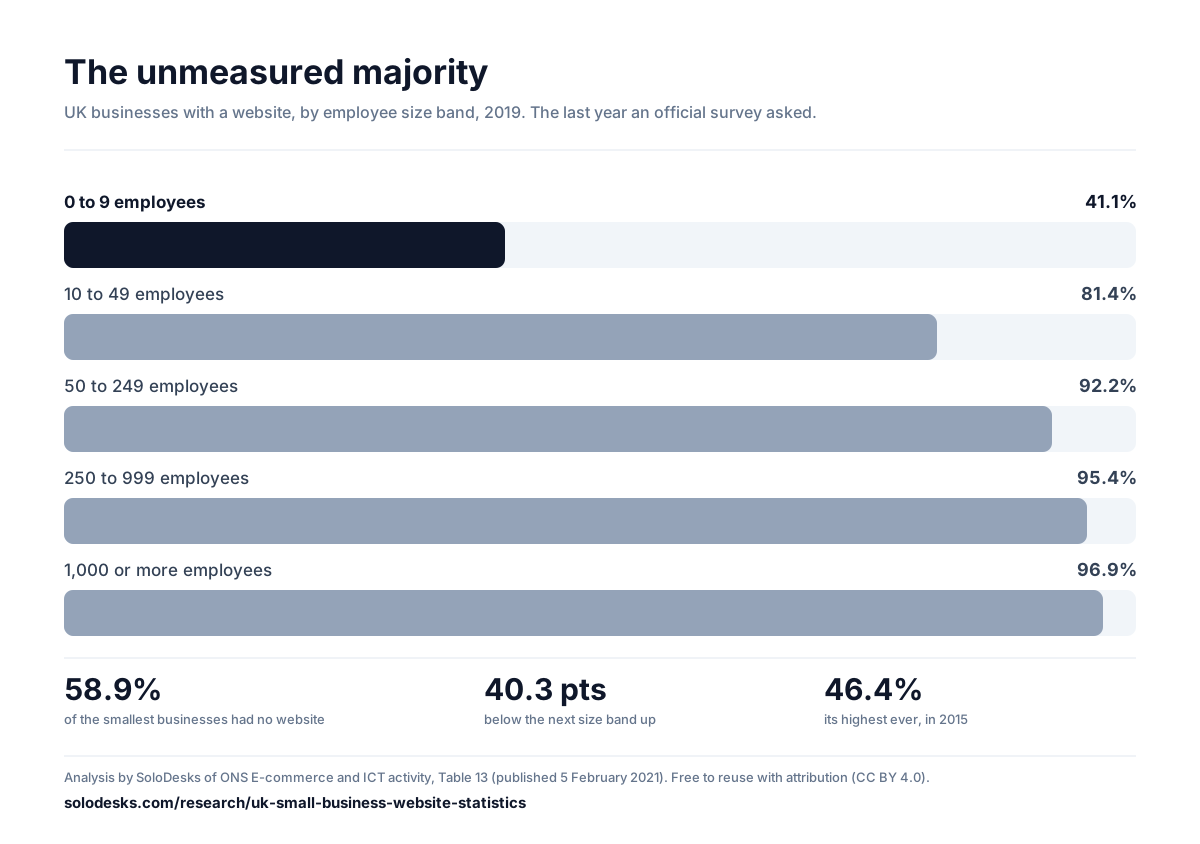
The whole finding as one picture, credited in the markup.
<figure>
  <img src="https://solodesks.com/research/website-cliff.png" alt="The unmeasured majority. Share of UK businesses with a website in 2019 by employee size band, showing 41.1% for businesses with 0 to 9 employees against 81.4% for those with 10 to 49" width="1200" />
  <figcaption>Source: <a href="https://solodesks.com/research/uk-small-business-website-statistics">Analysis by SoloDesks of ONS E-commerce and ICT activity, 2019 edition, Tables 13 and 21.</a></figcaption>
</figure>
Or take the file: PNG (2400px wide) · SVG (scales to any size). Both carry the source line and the link.


As a reference
For a report, a footnote or a reference list.
SoloDesks (2026) Six in ten of Britain's smallest businesses had no website, and nobody official has checked since 2019. Available at: https://solodesks.com/research/uk-small-business-website-statistics
Questions
- What proportion of UK small businesses have a website?
- The last official measurement found 41.1% of UK businesses with 0 to 9 employees had a website, in 2019. That leaves 58.9% without one. For comparison, in the same year 81.4% of businesses with 10 to 49 employees had a website and 96.9% of businesses with 1,000 or more employees did.
- Why is there no more recent figure than 2019?
- The ONS E-commerce and ICT activity survey, which asked the question, published its last edition for the 2019 reference year in February 2021. It was replaced by the Digital Economy Survey, which measures whether businesses make sales through a website rather than whether they have one. That survey was then paused and did not collect data for 2023. ONS has published no date for its return.
- Does 0 to 9 employees mean sole traders?
- No, and the difference matters. The band puts a one-person business in the same figure as a nine-person one. Website ownership rises with headcount in every other row of the same table, so the figure for one-person businesses alone is very likely lower than 41.1%. How much lower is not published and cannot be derived from this source, so we do not estimate it.
- Is there a figure for tradespeople or the construction sector?
- Not in this source. The ONS survey covers construction, but the website-ownership table is broken down by size of business only, with no industry split. Anyone quoting a trade-specific website figure from this release is quoting something that is not in it. Measuring that directly is the second half of this study.
- Can the year-to-year changes be read as a trend?
- No. ONS records a discontinuity in this series: the 2018 survey moved from a paper questionnaire to an electronic one, and the change affected results for the 0 to 9 employee band specifically. What survives the break is the level rather than the direction. In every year the smallest businesses were surveyed, from 2014 to 2019, fewer than half of them had a website.
- Why did nobody report this number at the time?
- Because the bulletin accompanying the data told readers not to lean on it. It states that its analysis focuses on businesses with 10 or more employees, as results for those are considered more robust, and that figures for smaller businesses are in the dataset but should be used with caution. Coverage of the release followed the bulletin. The figure was published and then went unread.
If you are one of the 58.9%
A statistic is not advice. The practical question underneath this one is whether a business of one needs a website at all, what a customer actually checks before they ring, and what belongs on the page they land on. That is written up separately, without the spreadsheets.
Disclosure: SoloDesks makes quoting and invoicing software for solo tradespeople, and part of that product is a public profile page. That makes us an interested party in the question of how many small businesses have a website, which is why the method above is pre-registered and why the limitations are printed in full. Free to reuse with a link, under CC BY 4.0. How we source and date every number is set out in our editorial and sourcing policy.